Nieman Foundation at Harvard
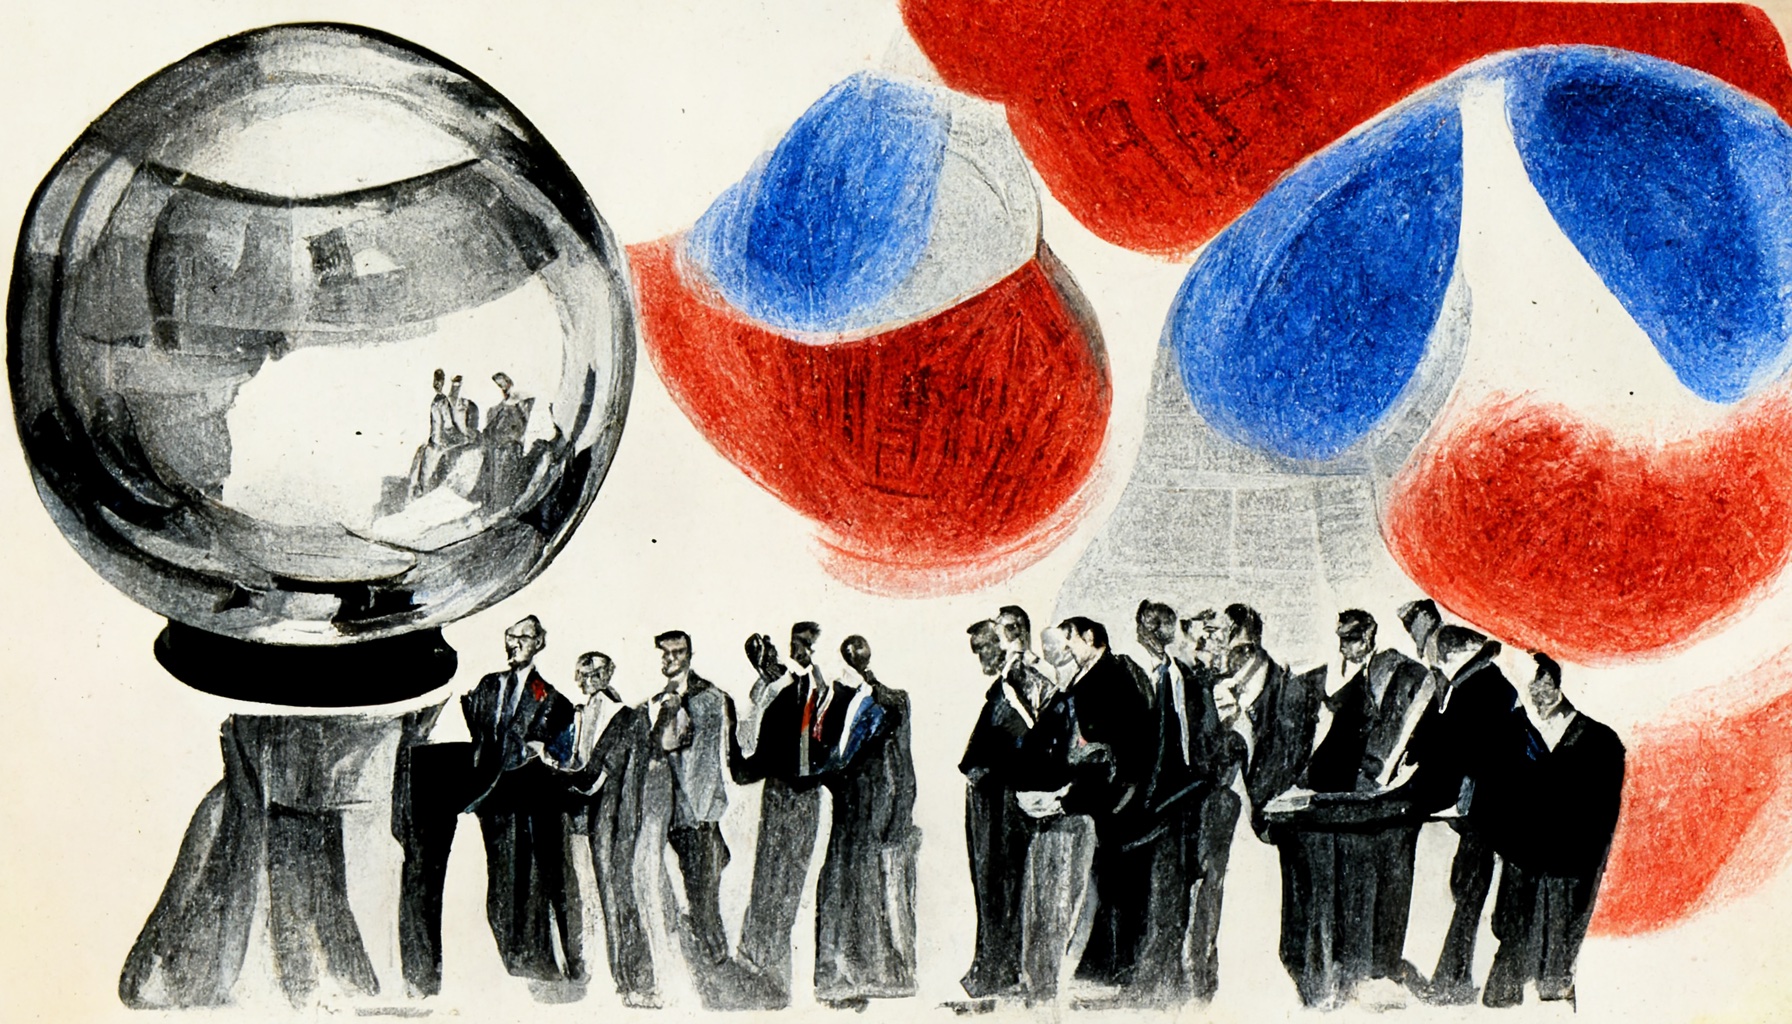
The midterm elections in the United States are today. Who’s leading, and who’s going to win? This is prime season for FiveThirtyEight, The Economist, and others to use their own election prediction systems to try to answer those questions. They build statistical models, drawing heavily on polls and other information, to simulate the possible outcomes.
The political stakes are high. For a while, FiveThirtyEight had the Democrats leading in terms of their chances for keeping control of the Senate. But more recently, the forecast has had Republicans pulling ahead. These are anxious days.

Publishing election predictions of this sort is controversial. Some critics, like Zeynep Tufekci, have argued we’d be better off ignoring them. They are devilishly complex and hard to get right. Already in 2022, both FiveThirtyEight and The Economist have acknowledged technical errors in their forecasts, publishing lengthy explanations about what happened and why. (They probably need to hire some quality assurance engineers.)
Predictions are also hard to communicate with the correct amount of uncertainty. One study found that “presenting forecasted win probabilities decreases the impression that an election is competitive compared to vote-share projections,” and that this decrease could potentially depress voter turnout by generating overconfidence in the predicted outcome. And people can misinterpret or mix up all the varying numbers put forward (probabilities, vote shares, seats won) — including journalists who report on them. For instance, Newsweek had to post a correction in July when it misinterpreted FiveThirtyEight’s forecast as meaning that the Republicans would win 60 seats in the Senate, rather than that they had a 60% chance of winning a majority in the Senate.
Given their potential to impact behavior and be misinterpreted, it’s important to understand how pervasive these predictions are in people’s media diets. To do that, I looked at some data from Comscore. Comscore maintains a panel of more than 1.3 million people who consent to having their internet activity measured. Using this panel data, which tracks desktop browsing behavior, we can estimate just how many people visited FiveThirtyEight’s and The Economist’s forecasts in 2020.
In all of 2020, there were 336,000 visits recorded within Comscore’s panel to any of FiveThirtyEight’s election forecast pages. These visits came from at least 5,202 people, who represent about 0.38% of the Comscore panelists. If we extrapolate these numbers to the U.S. adult population in 2020, we can estimate that perhaps 1 million people visited the FiveThirtyEight election forecast pages, and there were maybe around 64 million visits to those pages in total. The numbers were much, much lower for The Economist (panel: 5,407 page impressions, 641 visitors; U.S. adult population: ~120,000 total visitors, ~1,000,000 total visits), so I’ll focus the rest of this post on FiveThirtyEight.
Here’s how the visits vary over time, showing a clear peak on Election Day:

On November 2, 2020, the last full day before the U.S. presidential election, there were 16,657 panel visits to FiveThirtyEight’s forecast, which was only 0.002% of the total traffic generated by the Comscore panel that day. This was from 510 unique visitors, or about 0.15% of the active panel that day.
The vast majority of visits to FiveThirtyEight’s forecasts went to its top-level forecast page. Only about 1% of visits went to the Senate or House forecast pages or to specific state races. When there was traffic to subpages, it went disproportionately to the more competitive races in states like Pennsylvania, Florida, Texas, Georgia, and Arizona.
I also looked at which other sites were sending traffic to FiveThirtyEight’s forecasts. Were they a hit on Facebook or a popular search on Google? It turns out not: 98% of traffic to the predictions came from FiveThirtyEight’s own homepage. Strikingly little traffic came in externally from search, social media, or other news media.
This suggests that the audience for these forecasts is going directly to the homepage and then clicking into the forecast from there — a dedicated audience that is purposefully seeking out the forecasts rather than bumping into them via other channels. Even go.com, whose parent company Disney also owns FiveThirtyEight, only drove about 0.8% of the forecast’s traffic. Outside of FiveThirtyEight’s core audience, the reach of the forecast seemed rather limited.
Of the 5,202 people who visited the FiveThirtyEight forecast at any time in 2020, I was able to link 3,449 of them to panelist demographic info. (The rest of the traffic lacked panelist identity information.) Based on that data, I can say that the audience for the FiveThirtyEight forecast was probably what you’d expect: whiter, older, and more male than the panel as a whole. It was 68% male (vs. 53% for the whole panel), 94% non-Black (vs. 82.6% for the panel), and with an average age of 53 (vs. 44 for the panel).
So far, we’ve seen that the audience for election predictions was somewhat limited in terms of direct visits — reaching perhaps a million people. But what about people who might have seen the predictions reported in other media? Some critics have suggested that elites (like Jim Comey in 2016) might be moved to action by an air of confidence engendered by prediction-driven coverage.
To look at this, I gathered data from GDELT, a massive online tracking project that ingests content from thousands of news sites. I collected all English-language news articles that contained the key terms “FiveThirtyEight” and “forecast” between August 12, 2020 (when the forecast launched) and Election Day, November 3, 2020.
In total, there were 663 such articles in the dataset, an average of about eight per day. The sources of those articles were diverse — national media like The New York Times and The Washington Post, but also lots of local TV stations, newspapers, and other outlets that might reach a more local audience. The outlets that wrote about the forecast most included MSN (77 times), Newsweek (35 times), and Yahoo News (12 times). Here are the top 20 sources.

Overall, we find that the reach of FiveThirtyEight’s election predictions in 2020 was fairly limited — perhaps to around a million people — with most of the traffic driven directly by the homepage of FiveThirtyEight itself. Little traffic came from search or social platforms, or even from direct links from news media. The audience for these predictions seems similar to the audience FiveThirtyEight has built — which is whiter, older, and more male.
It’s worth thinking about the political implications of election predictions, given this narrower audience. But there’s also a not-insubstantial audience for the predictions as they get reported on and published by other media outlets. How exactly those media talk about the predictions — how precisely they treat the numbers and how transparent they are about uncertainty — is something I’d like to look at in the future.
Nicholas Diakopoulos is an associate professor in communication studies at Northwestern University, where he is director of the Computational Journalism Lab. He is currently on sabbatical as a visiting researcher at the University of Amsterdam IVIR. He thanks Northwestern’s Jack Bandy for facilitating access to the Comscore data analyzed for this post.